Case Study
How we took a D2C brand from “ads aren’t working” to a peak 44.91x ROAS.
A real story — real spend, real screenshots, real revenue. This is what happened behind the numbers you saw on the homepage.
Where the brand was when they came to us
When the founder first got on a call with us, the ad account looked like most D2C accounts we see — a mix of old campaigns, three or four ad sets fighting for the same budget, and a Shopify dashboard that never really moved. Some days ROAS was 4x, most days it sat under 2x. The founder was doing everything right on the product side, but the ads were leaking money quietly, every single day.
They didn’t want another “strategy deck”. They wanted their store to actually make money. That’s the only reason we took the account on.
The first two weeks — cleaning the account, not touching the budget
We didn’t double the spend on day one. That’s the mistake most agencies make. Instead, we killed the campaigns that had been running out of habit, pulled the audiences that were overlapping, and rebuilt the pixel and event setup so the numbers we were reading were actually the numbers happening on the store. Half the account died in week one. The other half started breathing.
Then we rewrote the creative brief from scratch. Not another “lifestyle reel”. We wrote hooks the way a person actually talks — the first line had to stop a thumb, the second line had to make the viewer feel seen, and the offer had to be impossible to scroll past. Twenty concepts in the first sprint. Static, UGC-style, founder-led, product-first. We didn’t guess which one would win. We let the market tell us.
When the numbers started moving
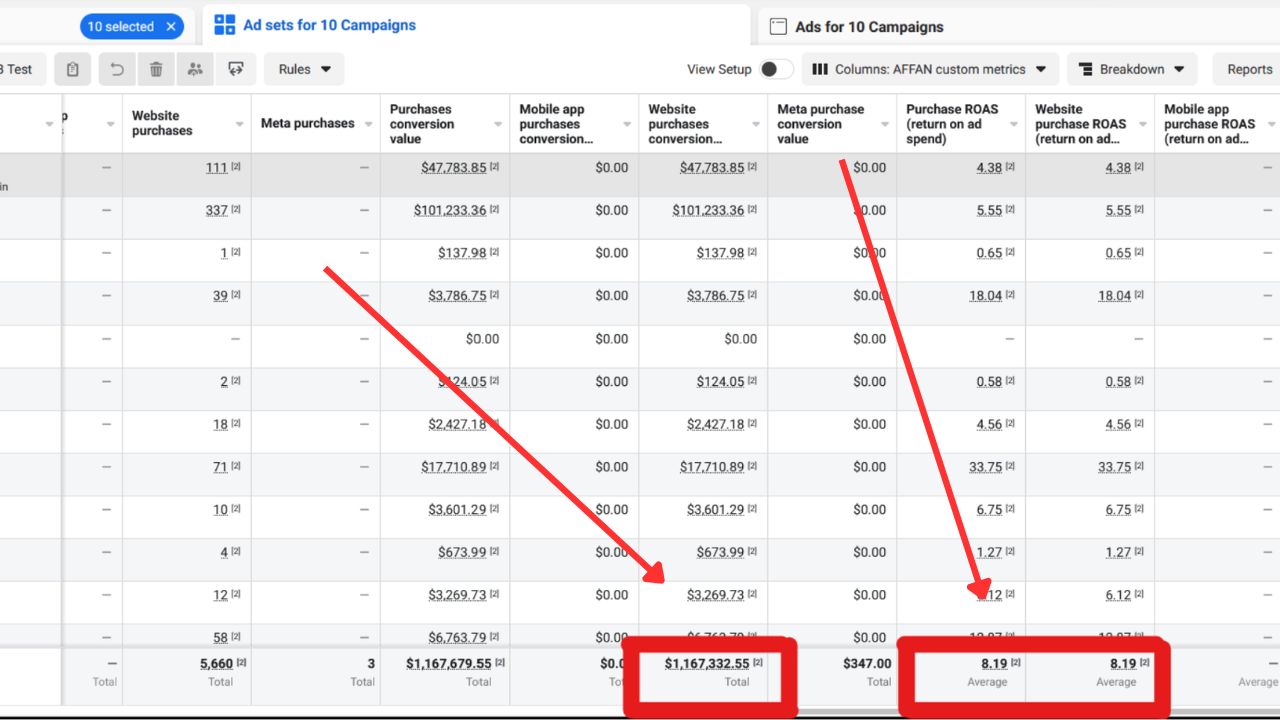
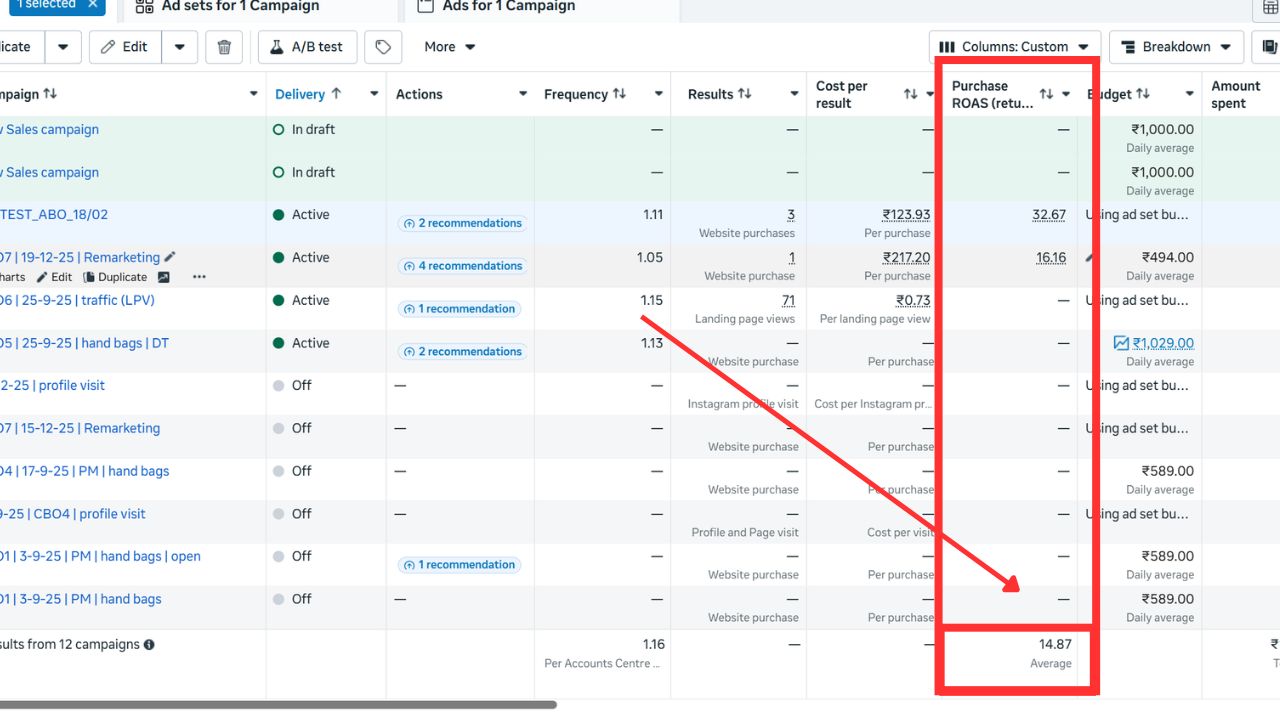
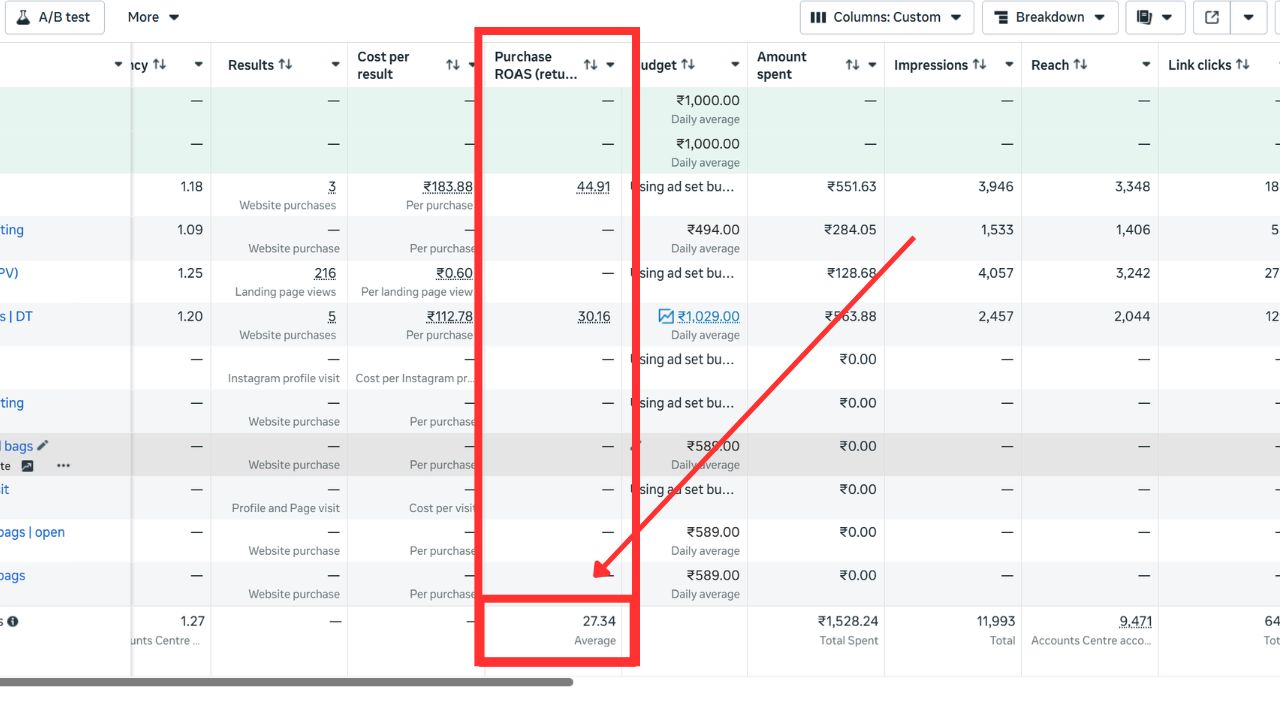
By week three, one CBO structure hit 34.90x ROAS on a single handbag SKU. A week later, a sister campaign on the same product touched 44.91x. And this wasn’t a lucky day — the twelve campaigns around it were averaging 27.34x. That’s the difference between a spike and a system. A spike you screenshot and forget. A system you scale.
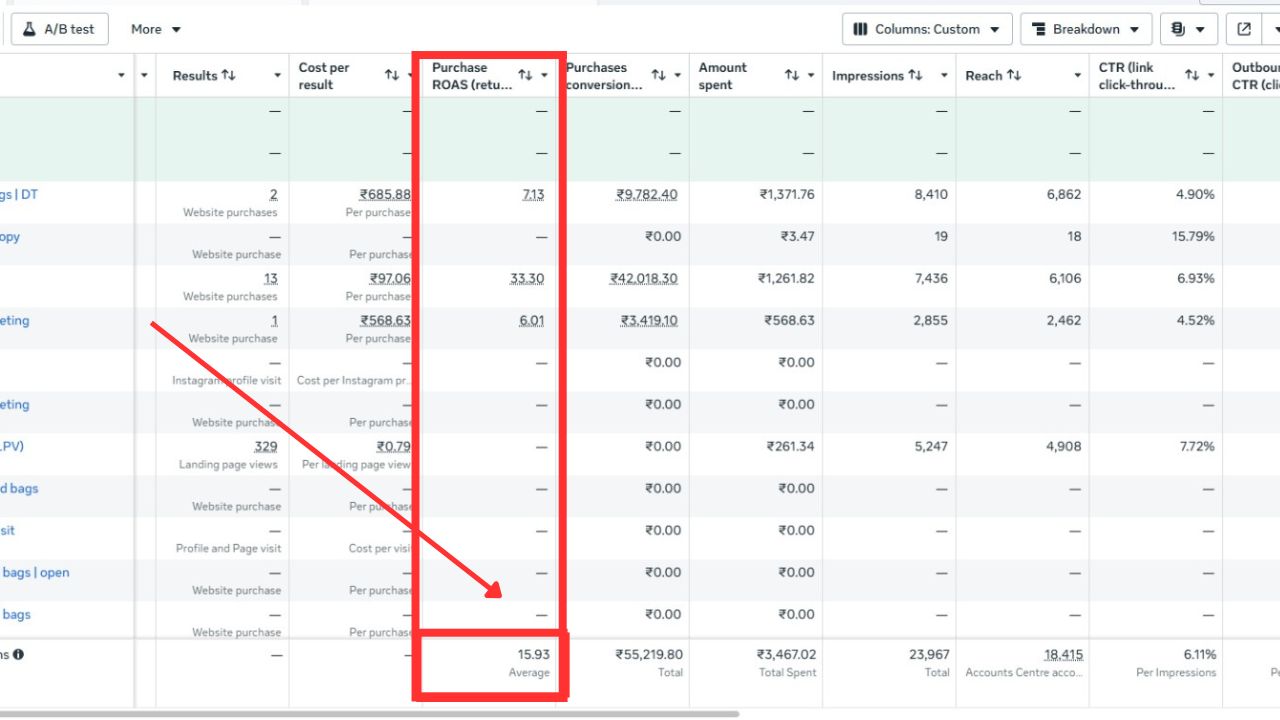
We were spending ₹9 per click. The average order value was ₹3,467. The math was so clean it almost felt wrong. The founder messaged us at 11pm asking if the dashboard was broken. It wasn’t. It was just the first time the account was actually working.
Scaling without breaking anything
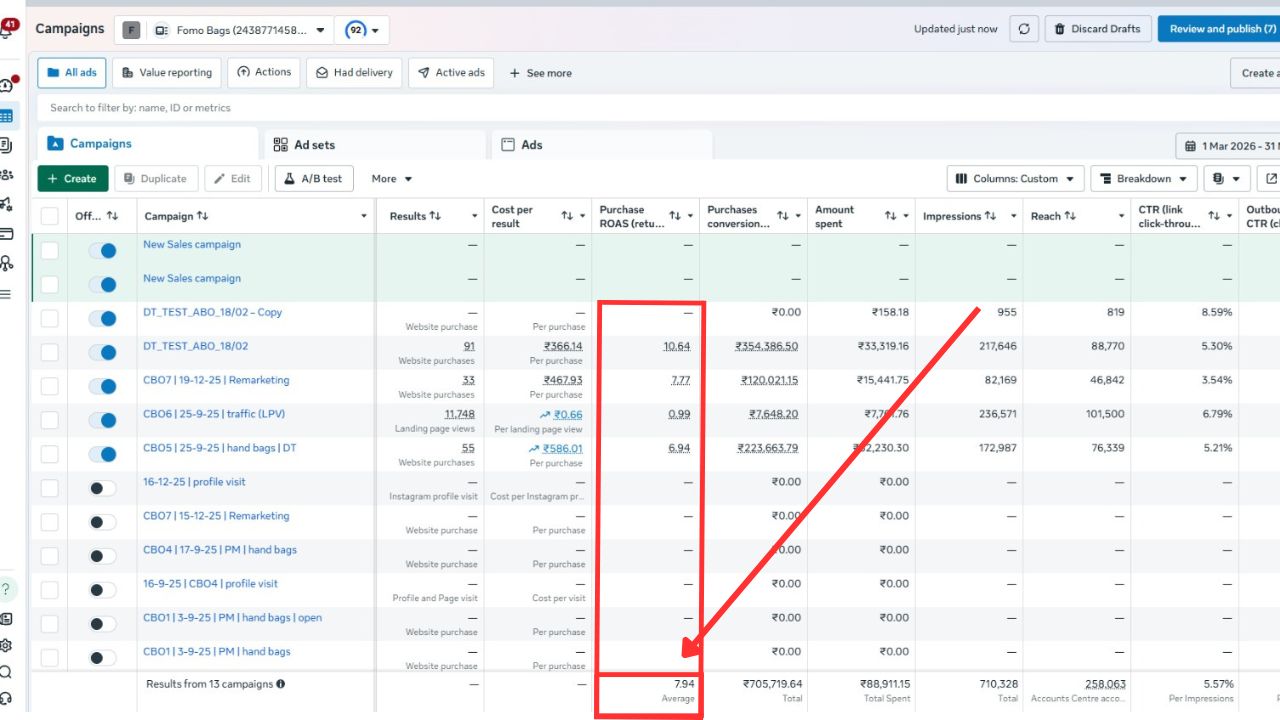
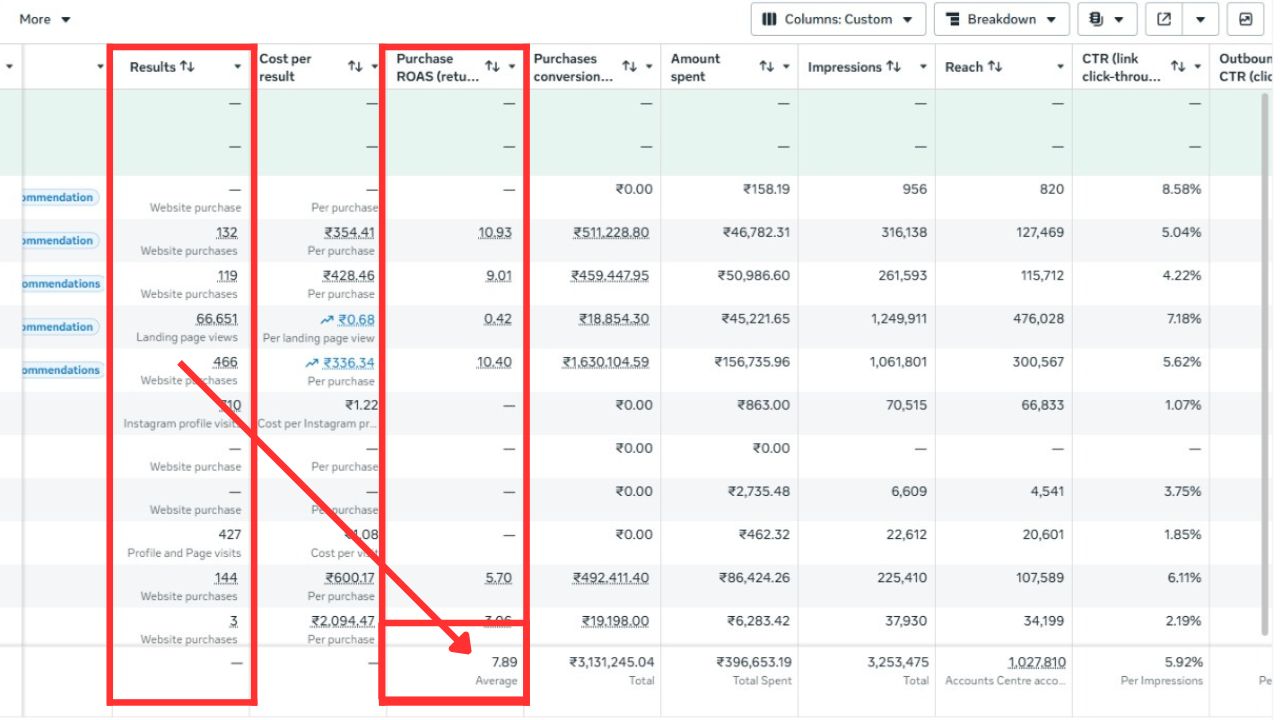
Anyone can push spend. The real job is pushing spend without watching ROAS collapse. We moved the daily budget up in 20% steps, not 200%. Every increase had a rule attached — if CPA drifts more than 15% for two straight days, we roll back. Boring? Yes. But this is the discipline that took the brand from ₹88,911 in spend at 7.94x, to ₹3.96 lakh in spend still holding a 7.89x average. The account got bigger. The efficiency stayed.
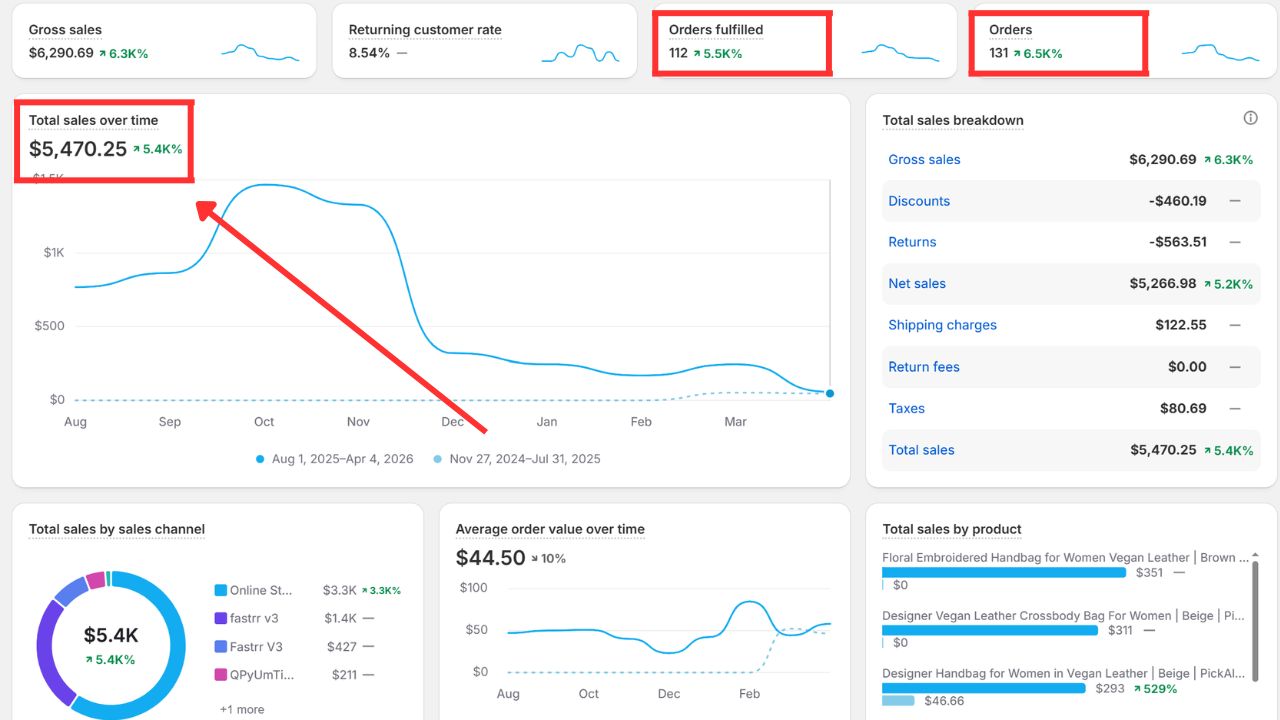
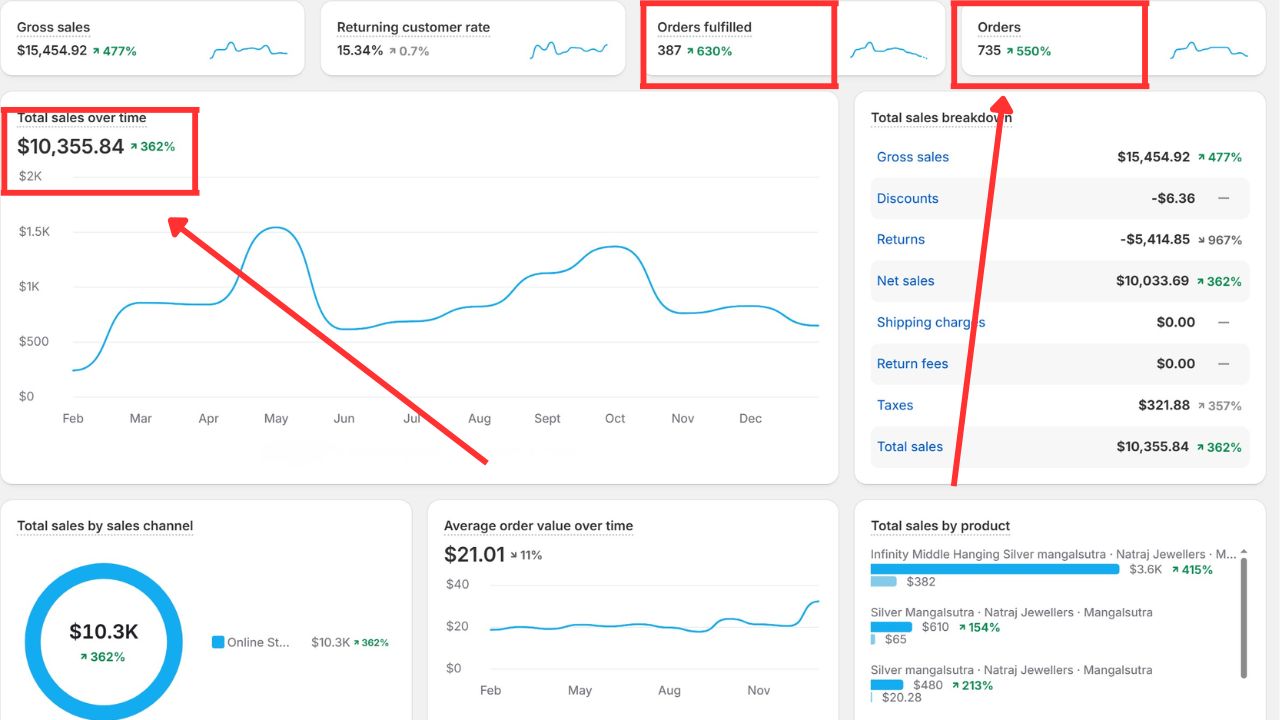
On another brand in the portfolio, the same playbook took the Shopify store from $121 to $10,355 in a single reporting window — a +362% jump — and pushed 735 orders through in the same month. A separate handbag brand went from near-zero to $5,470 with a +5,400% growth number that honestly looks like a typo until you see the screenshot.
The part nobody talks about — AOV
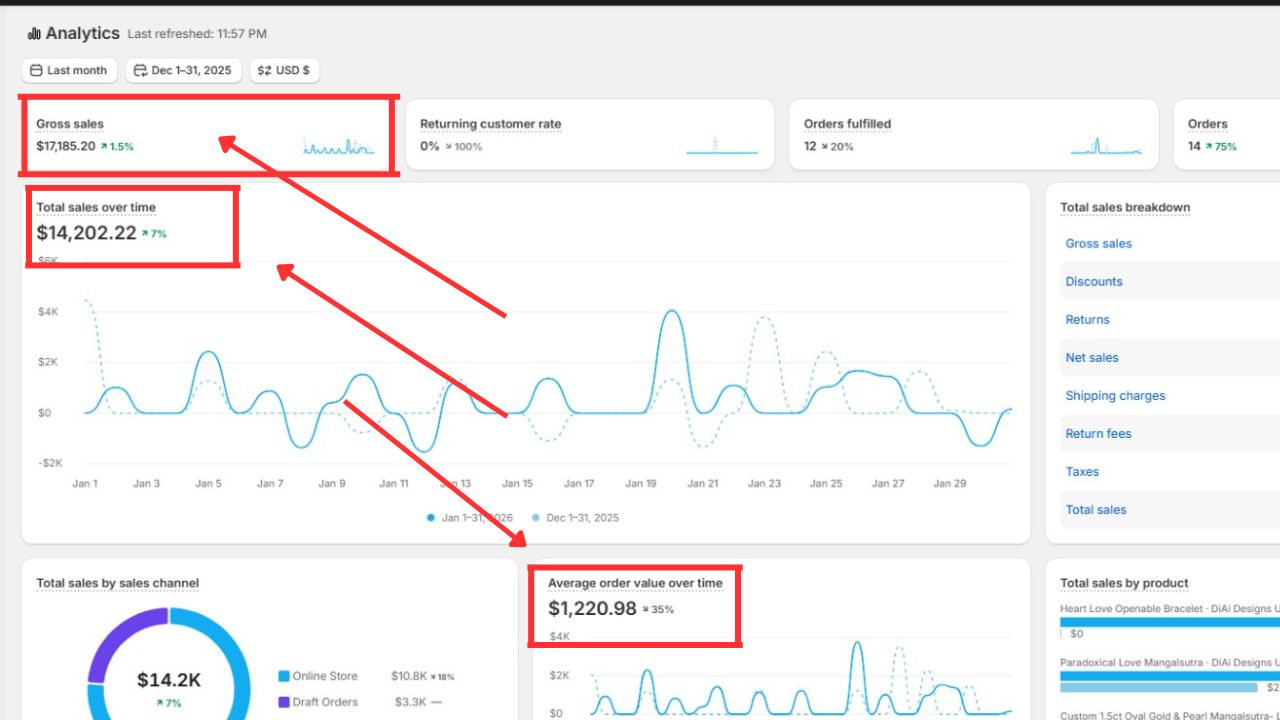
Everyone chases ROAS. We chase basket size too. On one store, we pushed AOV to $1,220 in December — meaning the customers we were bringing in weren’t just buying, they were buying premium. Bundle offers, tier pricing, one clean upsell on the cart page. Nothing loud. Just intentional. When AOV moves, every campaign underneath it gets more headroom. Suddenly a 3x ROAS is more profitable than the 6x you had last month.
Where the brand is now
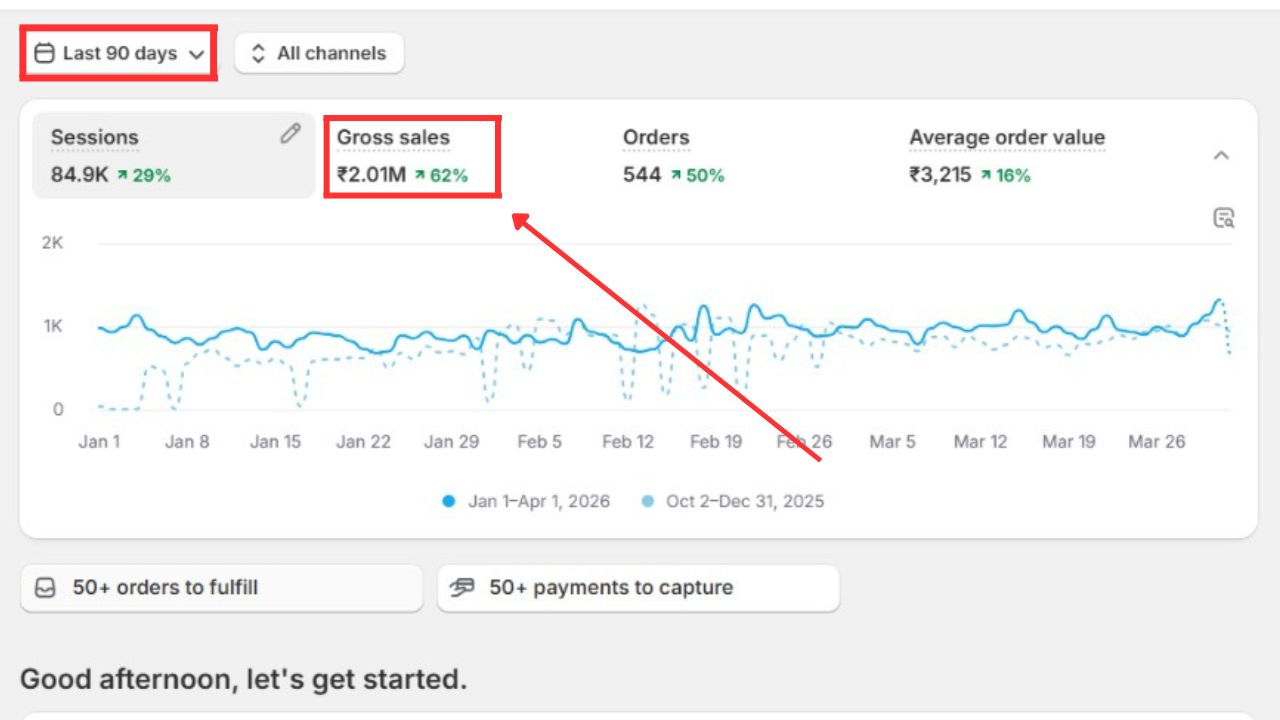
Across the accounts we run, we’ve tracked over ₹3.13 million in conversion value, a portfolio average sitting at 27.34x, and one store that just closed a 90-day window at ₹20.1 lakh in gross sales with a 62% lift over the previous quarter. Different brands, different products, same operating system underneath — clean setup, sharp creative, patient scaling, honest reporting.
The founders we work with don’t message us asking for ROAS updates anymore. They ask us how much more they can spend this month. That’s the shift we’re actually selling.
If you’re reading this and your account feels stuck
It’s probably not the platform. Meta and Google are working fine for other people in your category — that’s the hardest thing to hear, but it’s the useful thing to hear. The account setup, the creative, the funnel, the offer, the pricing ladder — one of those is quietly bleeding, and once it’s fixed, the numbers move faster than you expect.
We do one thing. We take D2C ad accounts and make them make money. If that’s the conversation you want to have, the call is free and we don’t pitch on it — we just tell you what we’d change.
Want your account to be the next screenshot?
Free 30-minute audit. No slides. Just what we’d fix.
All ten screenshots, in order
Unedited, straight from the ad managers and Shopify dashboards.